Independent Laboratory
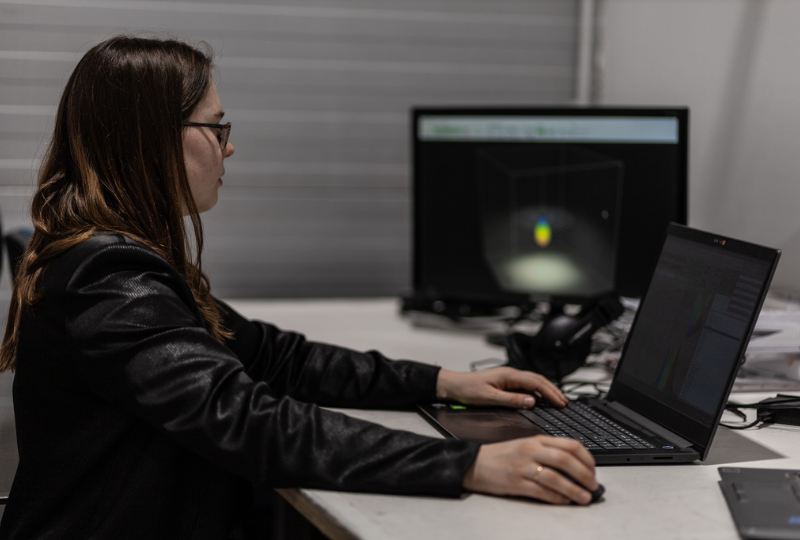
We verify your lighting performance parameters and show how your products behave in real-world conditions. Using high-precision instruments, we measure all relevant photometric values. Our laboratory is continuously updated with the latest technological advances, and our quality management system guarantees a high level of accuracy and reproducibility in every test.
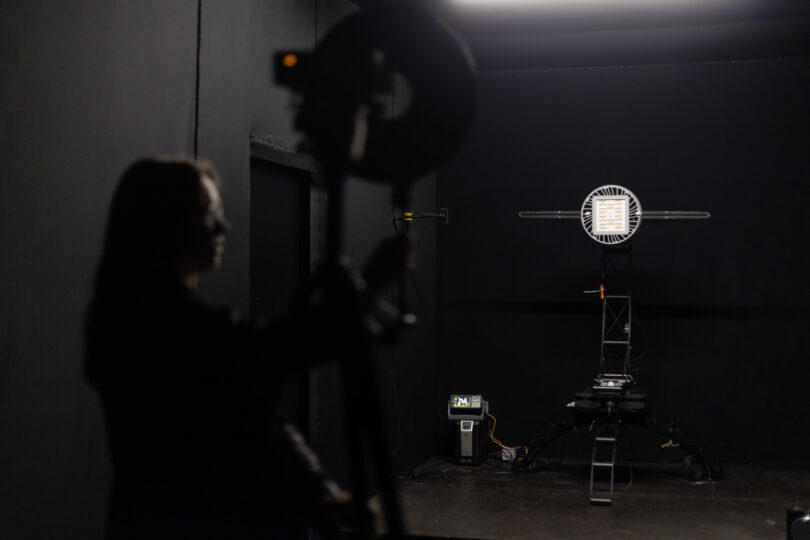
We use a Far Field Type C goniometer to analyze light characteristics, and to ensure accurate results that comply with LVS EN 13032-4+A1:2019 standard.
Our scope of accreditation includes:
- Luminous flux
- Efficacy
- Correlated Color Temperature (CCT)
- Color Rendering Indec (CRI)
- x, y chromaticity
Accreditation
Our lighting laboratory has already implemented a quality management according to LATAK accreditation T-696-00-2025. We use a Far Field Type C goniometer to analyze light characteristics, and to ensure accurate results that comply with LVS EN 13032-4+A1:2019 standard.
We create custom test reports based on individual client needs.
We create custom test reports based on individual client needs.
We create custom test reports based on individual client needs.
Below is the full list of parameters that can be included in test reports:
Electrical measurements
1.1 Input power, W
1.2 Input Current, A
1.3 Power factor
1.4 Frequency, Hz
Measurements of photometric quantities
2.1 Total luminous flux, lm
2.2 Partial luminous flux, lm
2.3 Luminous efficacy, lm/W
2.4 Peak Intensity (cd) and Beam Angle
2.5 Intensities (cd) for all measured C-planes and γ-angles
2.6 Luminous Intensity diagram (0 – 100 % of peak intensity)
2.7 Linear distribution diagram (Intensity vs γ-angle)
2.8 Spectral power distribution (SPD) / W/nm
Measurements of color quantities
3.1 Correlated Color Temperature (CCT), K
3.2 CRI
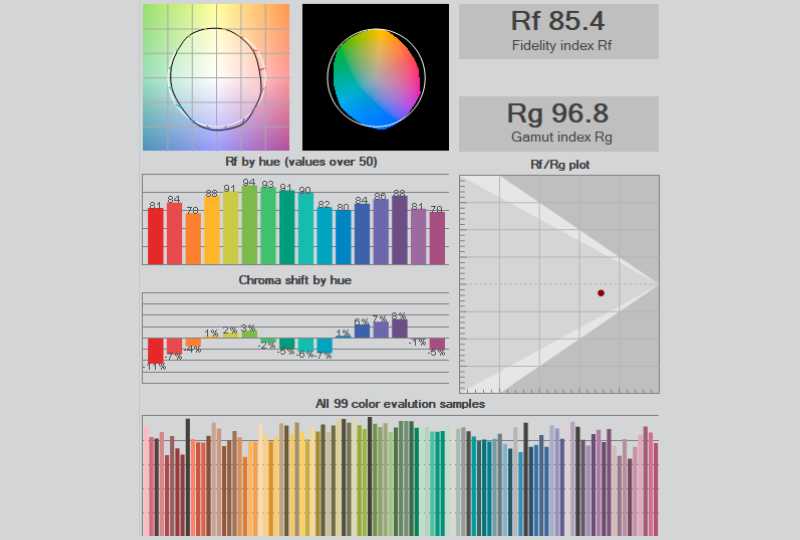
3.3 Rf, Rg
3.4 CQS
3.5 CIE 1931 (x;y)
3.6 CIE 1960 (u;v)
3.7 CIE 1976 (u’; v’)
3.8 Duv
3.9 MacAdam Steps
3.10 UGR table
3.11 BUG report
3.12 Iso- illuminance Diagram (Iso-lux)
3.13 Iso-intensity Diagram (Iso-candela)
3.14 Television Lighting Consistency Index (TLCI)
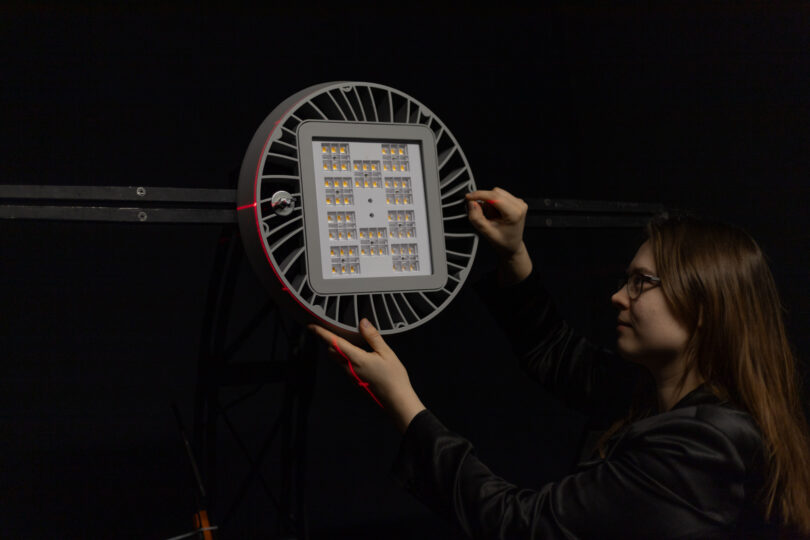
Device under test requirements:
Maximum luminaire size: up to 150 cm in diameter
Maximum weight: 25 kg
LDT and IES Files
EULUMDAT (.ldt) – Used for professional lighting design and enable optimization of lighting solutions.
IES files – A standardized format for describing the light distribution of individual luminaires.
Electrical measurements
1.1 Input power, W
1.2 Input Current, A
1.3 Power factor
1.4 Frequency, Hz
Measurements of photometric quantities
2.1 Total luminous flux, lm
2.2 Partial luminous flux, lm
2.3 Luminous efficacy, lm/W
2.4 Peak Intensity (cd) and Beam Angle
2.5 Intensities (cd) for all measured C-planes and γ-angles
2.6 Luminous Intensity diagram (0 – 100 % of peak intensity)
2.7 Linear distribution diagram (Intensity vs γ-angle)
2.8 Spectral power distribution (SPD) / W/nm
Measurements of color quantities
3.1 Correlated Color Temperature (CCT), K
3.2 CRI
3.3 Rf, Rg
3.4 CQS
3.5 CIE 1931 (x;y)
3.6 CIE 1960 (u;v)
3.7 CIE 1976 (u’; v’)
3.8 Duv
3.9 MacAdam Steps
3.10 UGR table
3.11 BUG report
3.12 Iso- illuminance Diagram (Iso-lux)
3.13 Iso-intensity Diagram (Iso-candela)
3.14 Television Lighting Consistency Index (TLCI)
Device under test requirements:
Maximum luminaire size: up to 150 cm in diameter
Maximum weight: 25 kg
LDT and IES Files
EULUMDAT (.ldt) – Used for professional lighting design and enable optimization of lighting solutions.
IES files – A standardized format for describing the light distribution of individual luminaires.